Rick Ness, Managing Partner Tactico
May 25, 2020 - 9 Min read

Rick Ness, Managing Partner Tactico
May 25, 2020 - 9 Min read
Writing this post has been a trying experience for us. We set out to provide thoughts on the market but it doesn’t take much analysis before the complexity of that task causes more questions about the input factors than answers about where we are headed. So, what started out as a short note that outlines Tactico’s strategy for investing going forward will now be a multi-part series. We will start with our expectations for the economy and then look at which industries we think will thrive and which industries we think will face serious difficulties post-crisis. Finally, we will look at all markets, not just equities.
In this article, we focus almost exclusively on the U.S. economy. As the largest economy in the world, we feel it serves as a useful indicator for the world in general.
In our opinion we are headed for a depression on par with the Great Depression of the 1930s. Pundits can and will quibble about recession vs depression in terms of percentage drop in GDP or rise in unemployment or the duration of the downturn. We believe the magnitude of the drop in GDP and employment makes the state of things obvious. By most definitions, negative growth and unemployment in double digits qualifies as a depression as opposed to a recession and we have likely already attained these levels. The unknown is the duration and in order to take a view on duration, it is useful to understand where the current levels of economic activity stand in comparison to history.
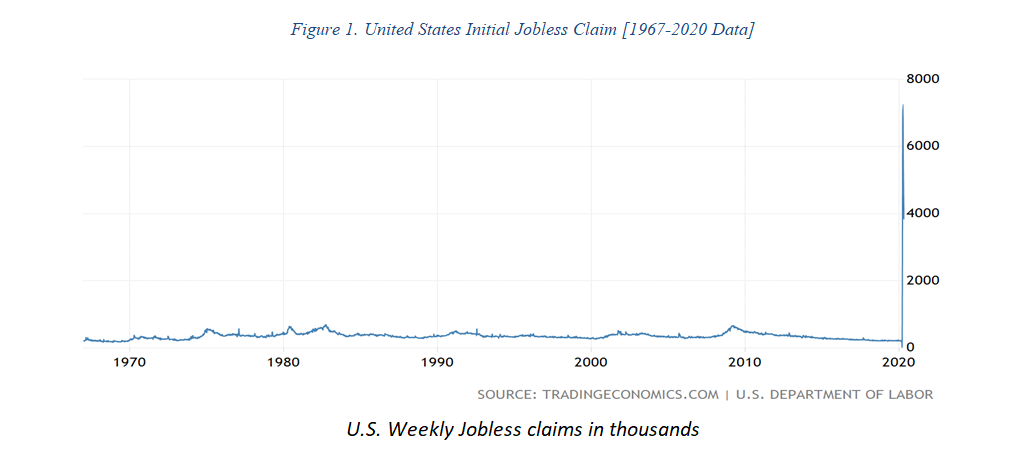
Today’s labour market as highlighted by jobless claims and the unemployment rate is what can best be described as extraordinary or an outlier. Figure 1 below shows total weekly jobless claims since the statistic was first created in 1967. The scale on the right is difficult to follow as the highest number prior to last month was 695 (000s)1.
In recent years, jobless claims have typically ranged between 200,000 and 300,000 per week. These jobless claims have been offset by roughly the same number of new jobs created causing a stable and steadily declining unemployment rate. The six week total of 33,483,000 jobless claims between March 22nd and May 3rd of 2020 as represented by the right side of the chart is a graphical representation of the cost of COVID-19 so far. We say so far as the claims are continuing in record numbers and rising unemployment will continue for as long as this is the case.
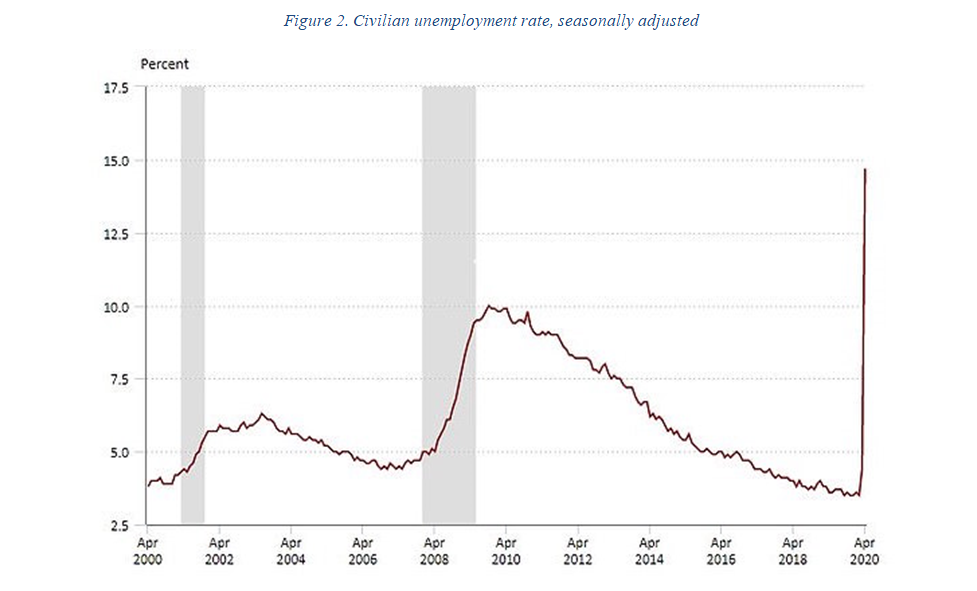
Jobless claims quickly lead to unemployment or to a decline in the labour force participation rate, or both. We will leave aside the drop in the size of the labour force as indicated by the participation rate as it is relatively small for the moment. The unemployment rate as of May 11th has reached 14.7% as shown in Figure 2 below2. It should be noted that this number only includes people who have lost their jobs. Temporarily laid off or furloughed workers are still considered employed. If we count those with a job but receiving no pay, the rate climbs to well over 20%.

As of May 2020, year-over-year U.S. unemployment has risen 10.7%. To put this in perspective, 2020 will be the 35th time in which the unemployment rate has grown year-over-year since 19293. Of the 35 times unemployment has risen, the number of times it has risen by 5% in one year is four. To be specific, it happened in 1930, 1931, 1932 and now 2020. A rise of 10.7% in one year-over-year period is a record, surpassing even the Great Depression.
The unemployment rate is sure to rise as it will not include the most recent jobless claims due to the lag between jobless claims and actual unemployment. The rate of new claims is likely to decline but it will be several weeks before we see a return to anything resembling February 2020 levels. It is estimated by some that unemployment will peak as high as 30%4. Our estimate is closer to 25%. This will be a rate equal to the highest previously recorded in 1933. The rate of change and the actual level of unemployment is what leads us to conclude that we are in a depression based on the effect reduced capacity utilization will have on GDP growth.
In Q1 2020, GDP declined by 4.8%5 annualized. This in a calendar quarter where annualized growth was trending at 1.9% until March 22nd, when the major shutdowns due to COVID-19 began to be enforced in states such as New York6. The period affected by the shutdown amounts to 9 of the 91 days in Q1 or 9.9% of the quarter. Q2, 2020 has seen the economy shut down for 48 of 91 days so far. This is likely to continue as we will see either a full or partial shutdown for the rest of the quarter implying an annualized GDP decline in Q2 of 34.9%7. Expanding this to a full-year projection, the optimistic model assumes COVID-19 restrictions will be relaxed worldwide starting July 1st. The model further assumes that the economy returns to normal in a straight line by October 1st. This would imply 2020 GDP as follows: Q1 (-4.8%); Q2 (-34.9%); Q3 (-17.5%) all numbers annualized. Year over year U.S. GDP growth in 2020 would be -13.8% in this scenario.
Should GDP for 2020 finish at -13.8% compared to 2019, it would surpass 1932 as the worst year since the American Civil War. It is important to note that the scenario described is the optimistic or V-shaped recovery where growth returns to something approaching normal this year. For this reason we view 13.8% is a minimum full year GDP decline for 2020.
Will we see a V,U or L shaped recovery? This will be determined by the length of time it takes to achieve year over year growth and in turn how long it will take to get back to where we were in 2019. The above V-shaped scenario indicates recovery to 2019 levels by late 2023.
The V-shaped recovery assumes that COVID-19 is the only problem the economy needs to overcome. It further assumes that there will be no second wave. Our belief is there will be no material second wave but many other factors will lengthen the duration of the down turn.
“Times are different now” is a familiar refrain and to a great extent, it is true. The Great Depression of the 1930s started as a mild recession in 1929 and accelerated when the stock market crash of October 1929 caused widespread panic in a weak and poorly regulated banking sector. The Federal Reserve’s failure to loosen monetary policy arguably made things worse. In an era when most currencies were tied to a gold standard, modern tools were unavailable to central banks. Dropping demand for goods and a lack of liquidity in money markets caused borrowers to fail, which in turn led to bank failures. This deleveraging of the economy caused further reductions in consumer spending causing a deflationary spiral that manifested itself as persistent double-digit unemployment for the entire decade. The much-needed government spending that eventually ended the Great Depression came in the form of military spending during World War 2.
In our current scenario, the Depression of 2020 is being triggered by a self-imposed shutdown. Central banks, including the U.S. Federal Reserve and governments worldwide are intervening with the largest peacetime monetary and fiscal stimulus plans in history. Will this be enough to prevent an extended contraction? We don’t believe so.
The cost and other long-term consequences of a massive increase in the deficit are potentially a good thing if the economic downturn is truly temporary. Our view is that there will be lasting consequences from the shutdown that will manifest themselves long after the shutdown is lifted. In certain instances, we believe several significant consequences will be permanent.
In the coming months businesses and households will be put under tremendous pressure, firstly as revenues drop to zero and then as bills come due while revenues return at a fraction of February 2020 levels. Cash is and will continue to be king for several quarters. Both households and businesses with strong balance sheets will likely survive. Those with too much leverage prior to the crisis will fail. This factor is where we believe the second economic downturn will come from, as businesses, households and governments were all heavily leveraged before the pandemic and it is about to get significantly worse as new credit becomes unavailable and the economy begins to deleverage.

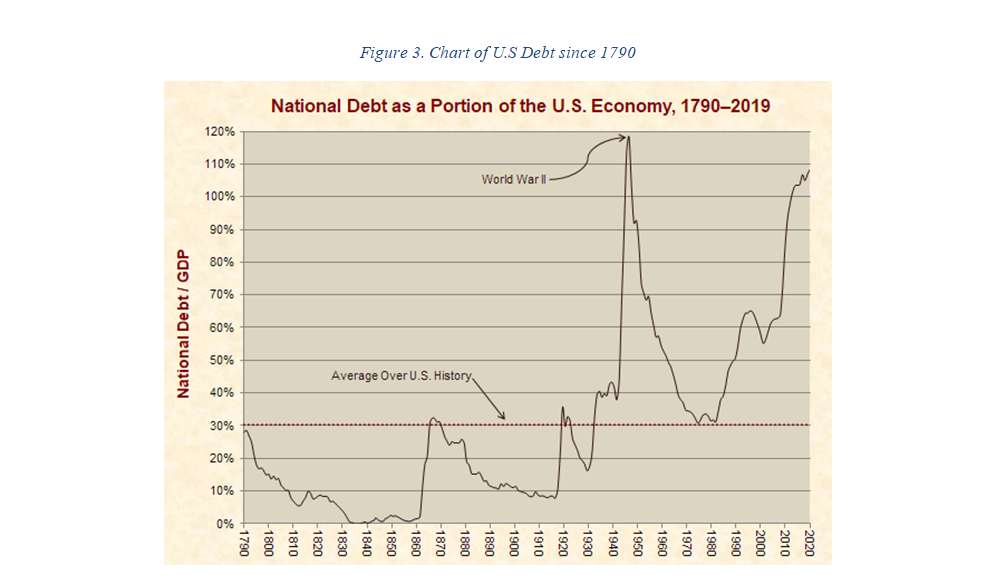
Figure 3 above shows the level of the National debt not including State, Municipal, Corporate and Household debt8. When all debts are included the U.S. total debt stands at $75.4 Trillion as of the end of 20199. This represents a total Debt to GDP ratio of 352%.
Owing what amounts to three and a half times annual earnings may seem excessive but in “normal times” it can be explained as reasonable. The concept is similar to a household that incurs a mortgage to finance an investment in a home. The total debt is irrelevant if earnings are adequate to service the debt. Over time in an inflationary environment, earnings and the value of the house will rise but the value of the debt stays constant eventually being inflated away. Depending on the service cost (interest rate), households can support many times their annual income in debt. When translating this to national debt and GDP, similar forces are at work. GDP will naturally grow for two reasons:
Similarly, the effect of inflation causes the real value of debt to decline in relative terms over time. This is a simplified rational for large ongoing government deficits and the quick recovery theory for the current crisis.
There are several problems with this view in today’s environment. If we continue with the home mortgage example, what happens when the homeowner’s income drops to zero? In the optimistic scenario, the homeowner will go to a bank and receive a deferral or second mortgage that is guaranteed by the government. If the bank lacks the cash reserves to make the loan, the Federal Reserve will provide liquidity by buying other assets from the bank so they can fund the loan. If in the course of the next few months, the homeowner is able to reestablish income, everything will be fine albeit at a higher level of debt. Eventually the bank will be paid and the Federal guarantee will never be triggered. The COVID-19 crisis will be a three-month forced vacation that will lengthen a mortgage by 3 to 6 months.
The pessimistic or U-shaped recovery scenario occurs if the homeowner is the proprietor of a retail clothing store in a mall. What happens if the economy reopens and only a tiny fraction of previous revenue returns? In this case we have the potential for a domino collapse. The homeowner’s business will go under. Loans that funded inventory will default. The small business owner will fail on the first and second mortgages on his or her home. He or she will fail on the remaining lease with the mall owner. The mall owner will fail on its mortgage with its bank. Regional banks concentrated in areas of high unemployment will become insolvent. Assets held by creditors will come on to the market for liquidation to recoup loan losses and prices in the short term will drop. Despite lower prices, consumption will decline due to credit becoming unavailable and unemployment. With prices falling due to liquidations and demand shrinking, further bankruptcies will ensue. This is the disaster scenario that begins to mimic the Great Depression of 1930.
The capacity of the Federal Reserve and government intervention is significant, but has its limits. Those limits are directly related to confidence in the U.S. Dollar and economy. Confidence will depend on the extent to which the Debt to GDP ratio climbs and the extent to which savers are willing to hold bonds issued by the government. There is no set number at which investors will flee a currency and seek other stores of value but when confidence starts to erode, it can quickly turn into a panic.
The U.S. ended 2019 with a Debt to GDP ratio of 107%10. Spending plans announced as of early May are indicating a budget deficit of a minimum of $4 trillion this year11. Should GDP decline by our estimate of 13.8%, Debt to GDP will end 2020 at 157%12. If international lenders or domestic savers balk at financing this debt, the government will have to raise interest rates to attract investors or face a loss of confidence in the Dollar that will result in inflation and ultimately hyperinflation or higher interest rates. A rise in interest rates would be devastating to households that are carrying record amounts of debt at a time when their ability to service the debt is severely impaired. Failures on household debt will perpetuate the cycle of bankruptcies. This is the scenario that leads us to believe we are in a depression that will last more than a few years.
On that cheery note, we will end our thoughts on the future of the economy. What does a venture capital firm like Tactico plan to do? Our view is there are clearly businesses and industries that will fail in the coming months. There are also clearly businesses that will fill the void. We purposely chose our retail store example as one that is highly likely to be in trouble. The customers of that traditional business will likely become customers in the digital economy. This is a hint to where a recovery could come from. In our next post, we will do a survey of the trends we believe have been accelerated by the COVID pandemic and what businesses will be the winners and losers.
We hope you will continue to follow our postings. We intend to continue financing successful early stage companies that will survive and thrive in the coming economy. We will also be involved in the consolidations and ownership structure changes that will be part of a recovery. We hope that you will join our platform for updated opportunities. www.tactico.com
1 “United States Initial Jobless Claims” Trading Economics, https://tradingeconomics.com/united-states/jobless-claims
2 Crane, Emily. “U.S. Unemployment Rate Hits 14.7% as More than 20.5 Million Lose Jobs.” Daily Mail Online, http://www.dailymail.co.uk/news/article-8300753/US-unemployment-rate-hits-14-7-20-5-million-lose-jobs.html
3Amadeo, Kimberly. “US Real GDP Growth Rate by Year Compared to Inflation and Unemployment.” The Balance, https://www.thebalance.com/u-s-gdp-growth-3306008
4Matthews, Steve. “Fed’s Bullard Says U.S. Jobless Rate May Soar to 30% In 2Q.” BNN Bloomberg, http://www.bnnbloomberg.ca/fed-s-bullard-says-u-s-jobless-rate-may-soar-to-30-in-2q-1.1410501
5Casselman, Ben. “Worst Economy in a Decade. What’s Next? ‘Worst in Our Lifetime.’.” The New York Times, http://www.nytimes.com/2020/04/29/business/economy/us-gdp.html
6Associated Press. “New York Shuts down; Cuomo Warns Socializing ‘Has to Stop and It Has to Stop Now’.” MarketWatch, http://www.marketwatch.com/story/new-york-set-to-shut-down-cuomo-warns-socializing-has-to-stop-and-it-has-to-stop-now-2020-03-22
7“Atlanta Fed GDPNow Estimate for 2020: Q2.” Federal Reserve Bank of Atlanta, https://www.frbatlanta.org/-/media/documents/cqer/researchcq/gdpnow/RealGDPTrackingSlides.pdf
8“BE INFORMED: national debt.” Just Facts, https://www.justfacts.com/nationaldebt.asp
9“Federal Debt: Total Public Debt as Percent of Gross Domestic Product.” Federal Reserve Bank of St.Louis, https://fred.stlouisfed.org/series/TCMDO
10“Federal Debt: Total Public Debt as Percent of Gross Domestic Product.” Federal Reserve Bank of St.Louis, https://fred.stlouisfed.org/series/GFDEGDQ188S
11Ritz, Ben. “America Is On Track For A $4 Trillion Deficit In 2020. Should It Matter?” Forbes, https://www.forbes.com/sites/benritz/2020/03/27/america-is-on-track-for-a-4-trillion-deficit-in-2020-should-it-matter/#791f81423660
12Calculated as follows: 2019 GDP of 21.43 Trillion minus 13.8 % = 2020 GDP of 18.46 Trillion divided by 2019 Debt of 24.95 Trillion plus 2020 Debt of 4 Trillion = Debt to GDP of 157%